Just felt like sharing with you one of our latest prototype which we created for a private foundation working in the field of energy awareness and sustainability in Switzerland called Cudrefin02.
I think that a major burden for people, who want to save energy at home, is for them to identify how much energy is consumed by different appliances. How much does my computer consume in operation / when it is powered off? Is the consumption of my energy-saving lamp significantly lower in the long run than the normal lamp I’ve got there? Such questions are key to understand where energy can be saved without too much effort. Currently available solutions, such as pluggable power monitors, are helpful, but do not fully fit the needs of individuals. They lack demonstrating power such as being able to compare consumption on a centralized screen, in an appealing manner.
In this project we implement a system that’s very simple to set up and that can be used in everyday life. As a first step each device to be monitored is coupled to a Plogg . These cool sensor nodes are a combination of an electricity meter plug and a data logger. They offer a Bluetooth interface to retrieve the current or logged consumption, making them great for appliance-level monitoring.
In order to automatically acquire the logged data, we extended the basic functionality of the Ploggs to feature continuous measurements on a fine, granular, time basis. In addition, we developed an integration of the Ploggs’ measurements to a web-based user interface which allows for attractive visualization and control as well as integration of the data on the web.
Thanks to the good cooperation with Energy Optimizers, makers of the Ploggs, we got access to a C-language API that enables us to connect to the core functionalities of the Ploggs. Our first component is a C++ gateway that discovers and manages the Ploggs. In order to enable interoperability with other applications, the gateway embeds a web server (SHTTPD) and offers access to the sensors’ functionality through simple and structured URLs, the web way!
As an example the monitoring data of all the available Ploggs, can be retrieved by accessing the following URL:
http://webofthings.net/energymonitor/ploggs/*
The gateway then discovers the devices and returns the results in the form of a JSON document:
[{

"deviceName": "ComputerAndScreen",

"currentWatts": 50.52,

"KWh": 5.835,

"maxWattage": 100.56

}, {…}]
The approach, that makes an application’s functionality accessible through a simple and well-defined web interface is often referred as RESTful, and has several advantages over more traditional interoperability approaches such as classic WS-* Web Services. First of all it is quite straightforward to use and integrate: any application that can access the web can consume RESTful services and any sensor that has an embedded web server can directly push content onto the web. Secondly, the use of JSON instead of XML reduces the need for complex parsers and requires very little bandwidth.
The second part of our software architecture is in charge of presenting the monitoring data to the end-user. We needed the interface to be attractive, easily-accessible (no additional software to learn or install) and to display real-time data rather than snapshots. Thus, we decided to use a web interface. The implementation is based on the Google Web Toolkit (GWT), a toolkit for building AJAX applications, as well as the OFCGWT toolkit which offers a set of customizable graphs. Using GWT, our application is written in Java and then automatically translated into client-side javascript. This javascript initiates a connection to the gateway every few seconds and directly translates the JSON Ploggs’ results into graphs.
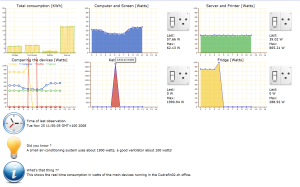
The attached screenshot is what the app looks like in action.
We are now trying to polish the whole application so that someone owning Ploggs could install it and run it within a few minutes. We’ll keep you updated about the advances and publish the code here as soon as we’ll release it!


